This post benchmarks a common modeling decision in SQL Server: should monthly values live as columns in a wide row, or as rows in a narrow fact-style table?
I took monthly sales and modeled it two ways. In Sales_Wide, months are columns (Jan through Dec). In Sales_Narrow, month is data (SalesMonth, Amount). I loaded 10,000 products across 5 years (2022-2026), which gave me 50,000 rows in Sales_Wide and 600,000 rows in Sales_Narrow.
For measurement, I used SET STATISTICS IO, TIME ON and looked at actual plan shape (scan vs seek). Then I ran the same business questions against both models: a single-month total and a Jan-Dec yearly breakdown.
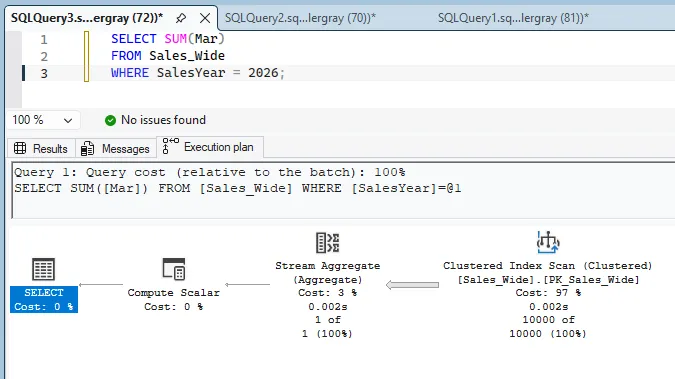
SELECT SUM(Mar)
FROM Sales_Wide
WHERE SalesYear = 2026;
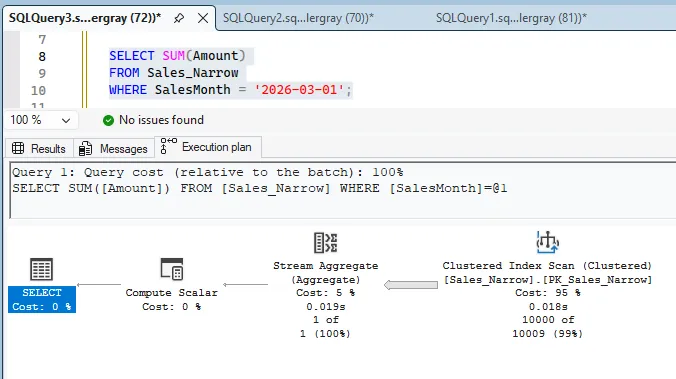
SELECT SUM(Amount)
FROM Sales_Narrow
WHERE SalesMonth = '2026-03-01';
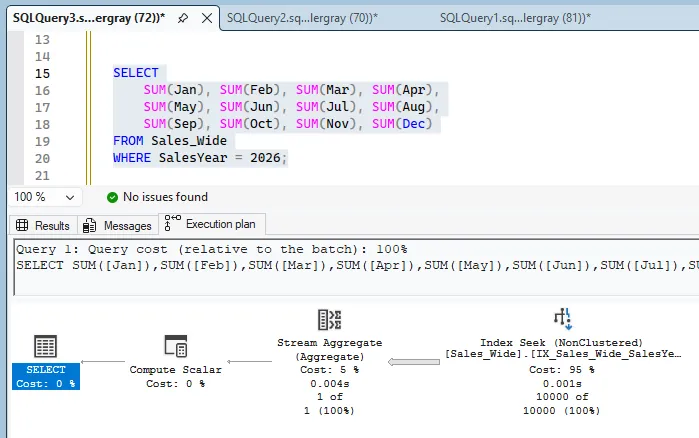
SELECT
SUM(Jan), SUM(Feb), SUM(Mar), SUM(Apr),
SUM(May), SUM(Jun), SUM(Jul), SUM(Aug),
SUM(Sep), SUM(Oct), SUM(Nov), SUM(Dec)
FROM Sales_Wide
WHERE SalesYear = 2026;
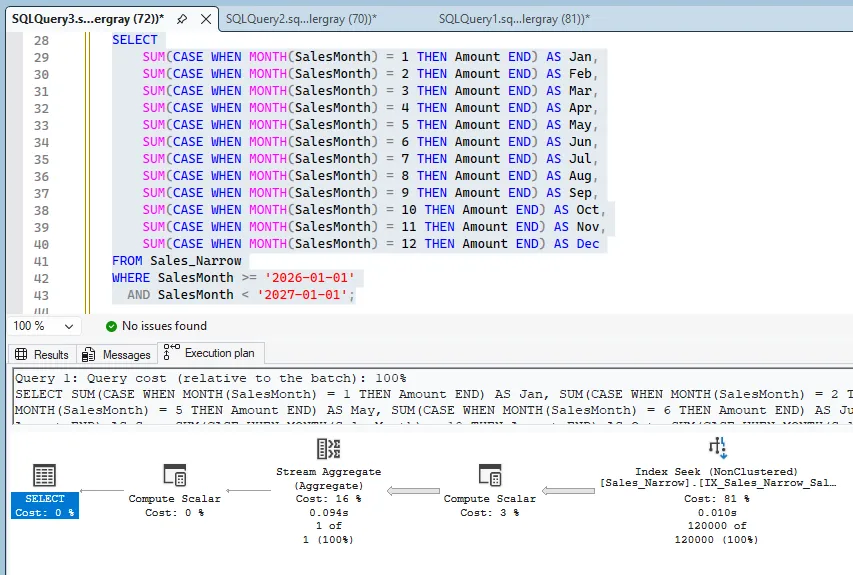
SELECT
SUM(CASE WHEN MONTH(SalesMonth) = 1 THEN Amount END) AS Jan,
SUM(CASE WHEN MONTH(SalesMonth) = 2 THEN Amount END) AS Feb,
SUM(CASE WHEN MONTH(SalesMonth) = 3 THEN Amount END) AS Mar,
SUM(CASE WHEN MONTH(SalesMonth) = 4 THEN Amount END) AS Apr,
SUM(CASE WHEN MONTH(SalesMonth) = 5 THEN Amount END) AS May,
SUM(CASE WHEN MONTH(SalesMonth) = 6 THEN Amount END) AS Jun,
SUM(CASE WHEN MONTH(SalesMonth) = 7 THEN Amount END) AS Jul,
SUM(CASE WHEN MONTH(SalesMonth) = 8 THEN Amount END) AS Aug,
SUM(CASE WHEN MONTH(SalesMonth) = 9 THEN Amount END) AS Sep,
SUM(CASE WHEN MONTH(SalesMonth) = 10 THEN Amount END) AS Oct,
SUM(CASE WHEN MONTH(SalesMonth) = 11 THEN Amount END) AS Nov,
SUM(CASE WHEN MONTH(SalesMonth) = 12 THEN Amount END) AS Dec
FROM Sales_Narrow
WHERE SalesMonth >= '2026-01-01'
AND SalesMonth < '2027-01-01';Before adding secondary indexes, narrow paid a large penalty because the month filter could not seek cleanly. You can see that immediately in the numbers.
| Query (lower is better) | Wide (No index) | Narrow (No index) |
|---|---|---|
| March logical reads | 710 | 1790 |
| March elapsed ms | 3 | 21 |
| Yearly logical reads | 710 | 1790 |
| Yearly elapsed ms | 46 | 131 |
Then I added the two indexes that match how these queries filter.
CREATE INDEX IX_Sales_Narrow_SalesMonth
ON Sales_Narrow (SalesMonth)
INCLUDE (Amount);
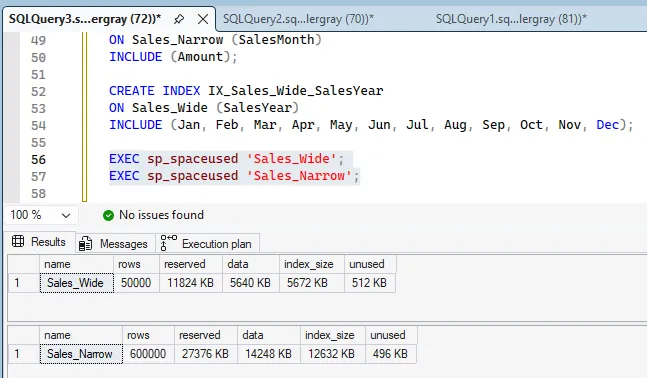
CREATE INDEX IX_Sales_Wide_SalesYear
ON Sales_Wide (SalesYear)
INCLUDE (Jan, Feb, Mar, Apr, May, Jun, Jul, Aug, Sep, Oct, Nov, Dec);After that, the comparison became much clearer. Sales_Narrow is excellent for single-month lookup, while Sales_Wide is still better for this fixed Jan-Dec report shape.
| Query (lower is better) | Wide (indexed) | Narrow (indexed) |
|---|---|---|
| March logical reads | 144 | 30 |
| March CPU ms | 0 | 0 |
| March elapsed ms | 4 | 0 |
| Yearly logical reads | 144 | 317 |
| Yearly CPU ms | 0 | 93 |
| Yearly elapsed ms | 31 | 116 |
Those results line up with the plans: both models move to seeks, but they still do different amounts of work for different query shapes.
There is also a storage tradeoff. The narrow model has more rows and, with supporting indexes, it consumes more total space.
| Table | Rows | Reserved (before idx) | Reserved (after idx) | Data | Index Size (after idx) |
|---|---|---|---|---|---|
| Sales_Wide | 50000 | 5832 KB | 11824 KB | 5640 KB | 5672 KB |
| Sales_Narrow | 600000 | 14472 KB | 27376 KB | 14248 KB | 12632 KB |
So what is better? In this demo, both are better at different things. If your core workload is a fixed cross-tab by year, wide is leaner for that output. If your core workload is time-centric filtering and slicing, narrow is the more natural model, as long as you index for that access path.
The practical takeaway is straightforward: model for the questions you actually ask, and back that model with the indexes those questions need.
One final note: if this same workload moved from monthly data to daily data, this tradeoff would usually tilt further toward the narrow pattern. A wide design based on time buckets gets harder to maintain and query as granularity increases, while a date-based narrow model stays consistent and indexable. We kept this demo monthly on purpose so the side-by-side comparison stays simple.
-- Repro setup (create and load demo data)
USE master;
GO

IF DB_ID('RowsVsColumnsDemo2026') IS NULL
    CREATE DATABASE RowsVsColumnsDemo2026;
GO

USE RowsVsColumnsDemo2026;
GO

DROP TABLE IF EXISTS Sales_Narrow;
DROP TABLE IF EXISTS Sales_Wide;
GO

CREATE TABLE Sales_Wide (
    ProductID int NOT NULL,
    SalesYear int NOT NULL,
    Jan money NULL,
    Feb money NULL,
    Mar money NULL,
    Apr money NULL,
    May money NULL,
    Jun money NULL,
    Jul money NULL,
    Aug money NULL,
    Sep money NULL,
    Oct money NULL,
    Nov money NULL,
    Dec money NULL,
    CONSTRAINT PK_Sales_Wide
        PRIMARY KEY (ProductID, SalesYear)
);

CREATE TABLE Sales_Narrow (
    ProductID int NOT NULL,
    SalesMonth date NOT NULL,
    Amount money NOT NULL,
    CONSTRAINT PK_Sales_Narrow
        PRIMARY KEY (ProductID, SalesMonth)
);

WITH P AS (
    SELECT TOP (10000)
        ROW_NUMBER() OVER (ORDER BY (SELECT NULL)) AS ProductID
    FROM sys.objects a CROSS JOIN sys.objects b
)
INSERT INTO Sales_Wide
SELECT
    p.ProductID,
    y.SalesYear,
    ABS(CHECKSUM(NEWID())) % 10000,
    ABS(CHECKSUM(NEWID())) % 10000,
    ABS(CHECKSUM(NEWID())) % 10000,
    ABS(CHECKSUM(NEWID())) % 10000,
    ABS(CHECKSUM(NEWID())) % 10000,
    ABS(CHECKSUM(NEWID())) % 10000,
    ABS(CHECKSUM(NEWID())) % 10000,
    ABS(CHECKSUM(NEWID())) % 10000,
    ABS(CHECKSUM(NEWID())) % 10000,
    ABS(CHECKSUM(NEWID())) % 10000,
    ABS(CHECKSUM(NEWID())) % 10000,
    ABS(CHECKSUM(NEWID())) % 10000
FROM P p
CROSS JOIN (VALUES (2022),(2023),(2024),(2025),(2026)) y(SalesYear);

INSERT INTO Sales_Narrow (ProductID, SalesMonth, Amount)
SELECT
    ProductID,
    DATEFROMPARTS(SalesYear, MonthNum, 1),
    Amount
FROM Sales_Wide
UNPIVOT (
    Amount FOR MonthName IN
    (Jan,Feb,Mar,Apr,May,Jun,Jul,Aug,Sep,Oct,Nov,Dec)
) u
CROSS APPLY (
    VALUES (CASE MonthName
        WHEN 'Jan' THEN 1 WHEN 'Feb' THEN 2 WHEN 'Mar' THEN 3
        WHEN 'Apr' THEN 4 WHEN 'May' THEN 5 WHEN 'Jun' THEN 6
        WHEN 'Jul' THEN 7 WHEN 'Aug' THEN 8 WHEN 'Sep' THEN 9
        WHEN 'Oct' THEN 10 WHEN 'Nov' THEN 11 WHEN 'Dec' THEN 12
    END)
) m(MonthNum);

SET STATISTICS IO, TIME ON;