If you watch baseball regularly, you already know counts matter. Hitting on 3-0 looks very different from hitting on 0-2.
I chose wOBA in this experiment because it captures overall offensive value better than batting average or OPS by weighting outcomes by their run impact. If you want a quick primer, FanGraphs has a good explanation of wOBA as a gateway statistic.
I grouped plate appearances by the count when the plate appearance ended, then calculated wOBA for each state using Statcast’s woba_value and woba_denom fields. The sample includes 43,891 plate appearances from 638 batters across all 12 count states (0-0 through 3-2), and the overall league wOBA in this sample was .325.
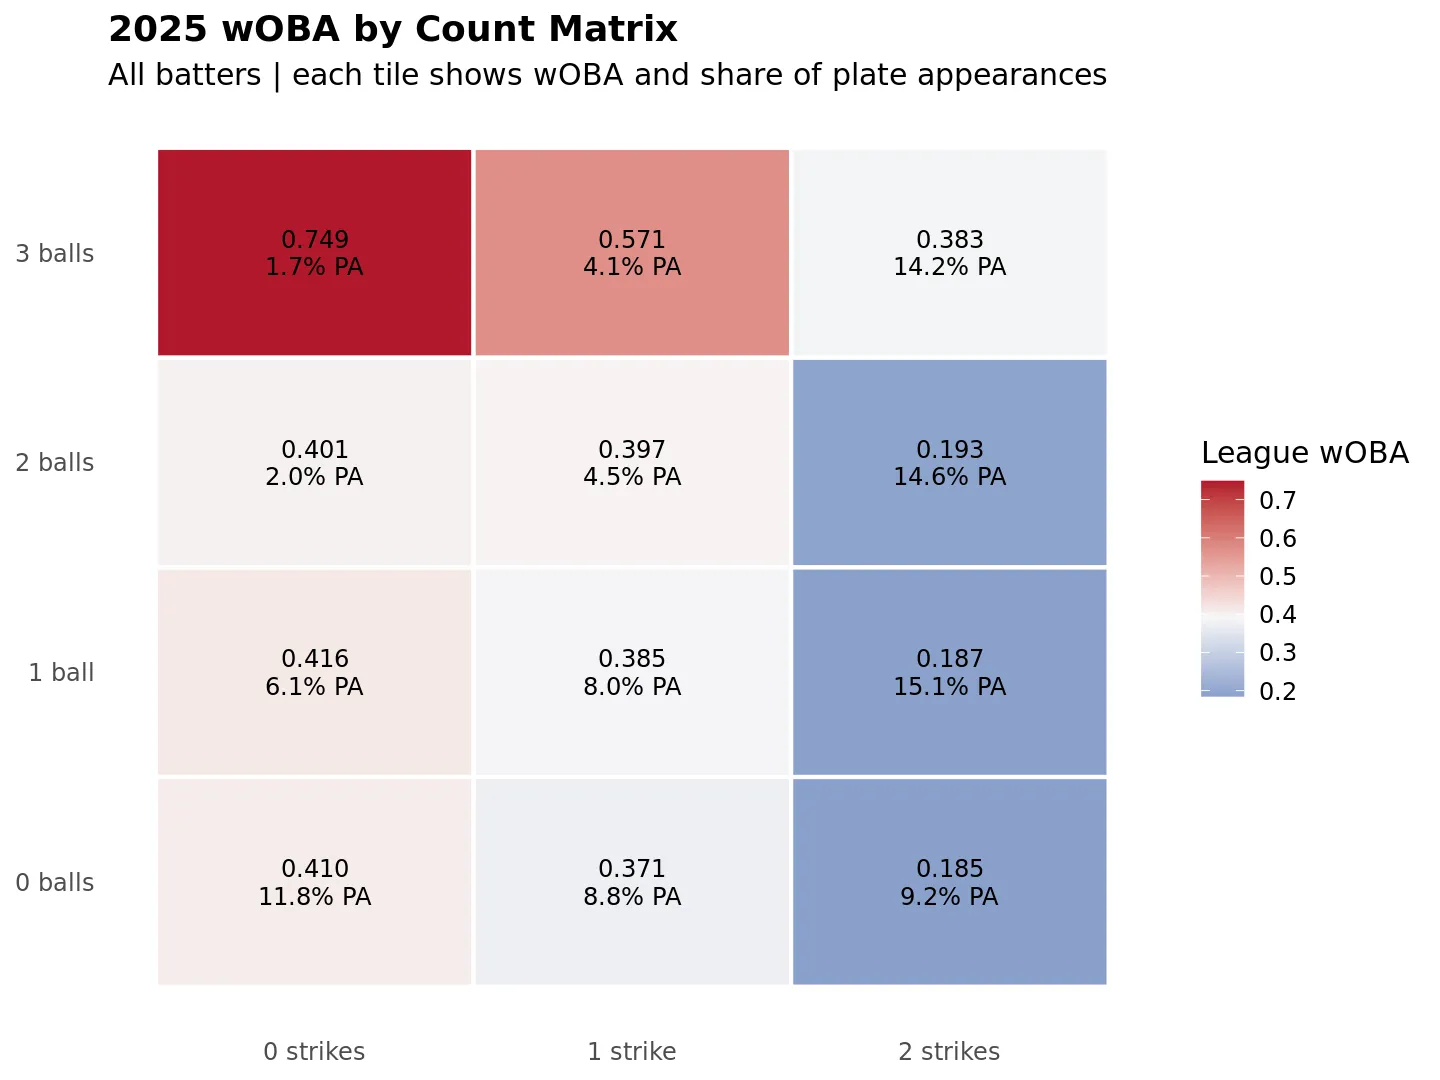
The spread is huge. The best count in the sample was 3-0 (.749), the worst was 0-2 (.185), and the gap between them was .564 wOBA points. Hitter-friendly counts are where the damage happens: 3-1 (.571) and 1-0 (.416) are both well above league average. On the other end, early two-strike counts sink offense, with 0-2 (.185), 1-2 (.187), and 2-2 (.193) all clustered at the bottom.
Full counts are an important exception to the two-strike trend. Even though 3-2 has two strikes, it came in at .383, much stronger than 0-2, 1-2, or 2-2. Walk pressure changes the at-bat for both hitter and pitcher, and the outcomes reflect that.
Frequency is part of the story too. The most common counts were 1-2 (15.1%), 2-2 (14.6%), and 3-2 (14.2%) of plate appearances. So while 3-0 is extremely productive, it only happened 1.7% of the time. Lower-value two-strike counts happen far more often, which helps explain why overall run production gets pulled down.
For analysis work, this is a reminder that count is core context, not a side variable. It helps to separate two different skills: how often a hitter gets into favorable counts, and how well that hitter performs once there. Looking at both gives a more useful picture than one overall wOBA number.
The 2025 count matrix lines up with baseball intuition and quantifies it clearly: hitters do the most damage in advantage counts, struggle in two-strike deficits, and spend a lot of time in those tougher states.